




Anatomy of a Rate Decision: Statement, Vote Split, Dot Plot

Every rate decision is more than a single number. When a central bank announces its policy rate, markets react to the headline, but the deeper signals usually sit in three places: the policy statement, the vote split and, for the US Federal Reserve, the dot plot. This rate decision guide breaks down each one: what to read, where to find it and why it matters.
Why the Headline Number Is Only the Start
Most of the top rate decisions each year are widely expected before they happen. Futures pricing, economist surveys and policymaker speeches usually point to the outcome days in advance. So the market reaction often depends less on whether rates moved and more on what the central bank signals about the path ahead.
A useful interest rate guide treats every decision as a package: the rate itself, the words around it, the votes behind it and the projections that follow. Read together, they give a far clearer central rate outlook than the headline alone.
Part 1: The Policy Statement
The statement is the official explanation of the decision. It is short, carefully drafted, and analysts compare it line by line with the previous one.
What to look for:
Changes in wording. Replacing one word, such as describing inflation as "elevated" instead of "easing", can shift expectations on its own.
The balance of risks. Statements often indicate whether policymakers are more concerned about inflation or about slowing growth.
Forward guidance. Phrases about future adjustments offer hints about the policy rate outlook without committing to a fixed path.
Comparing consecutive statements side by side, with every edit highlighted, is one of the simplest and best rate analysis habits you can build.
Part 2: The Vote Split
The vote split shows how many policymakers supported the decision and how many dissented. At the Fed, 12 members of the Federal Open Market Committee (FOMC) vote at each meeting. Other central banks publish similar tallies, such as the Bank of England's nine-member Monetary Policy Committee.
Why it matters:
A unanimous vote suggests the committee is aligned. A split, especially with dissents in both directions, points to active debate and a less predictable path.
Dissenters usually explain their reasoning, giving clues about where the committee could lean at future meetings.
A change in the split from one meeting to the next can be as informative as the decision itself.
Use this section as your top vote split guide: note who dissented, in which direction and whether the minority is growing. A single top rate vote split can grab headlines, but the best vote split data comes from tracking tallies across several meetings, so you see how the debate is evolving rather than reacting to one result.
Part 3: The Dot Plot
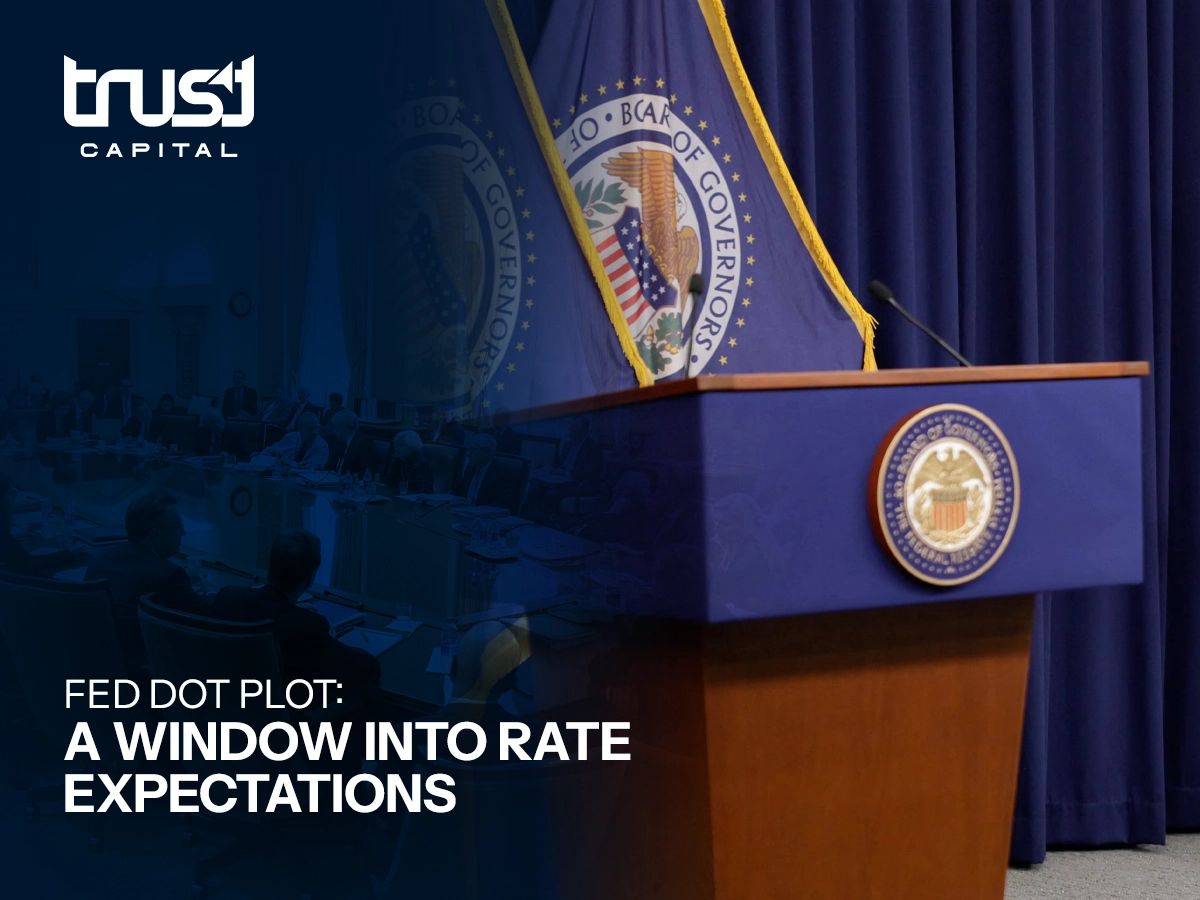
The dot plot is part of the Fed's Summary of Economic Projections, published four times a year in March, June, September and December. Each FOMC participant, including non-voting regional Fed presidents, places an anonymous dot showing where they think the federal funds rate should be at the end of each of the next few years and over the longer run.
How to read it:
The median dot is the headline figure most coverage focuses on.
The spread of dots shows the level of agreement. A tight cluster signals consensus. A wide spread signals uncertainty.
Changes versus the previous plot matter more than the level. Did the median move? Did the dots move closer together or further apart?
One point any dot plot guide 2026 readers rely on should stress: the dot plot is not a promise. Projections depend on how the economy develops and are often revised between meetings. Comparing dot plot trends in 2026 with earlier projections shows how frequently expectations shift, and the best dot plot trends analysis looks at direction and dispersion together, not the median alone.
Putting It All Together
The real signal usually appears when the three elements are read as a set. For example, a central bank may leave rates unchanged and keep its statement almost identical, yet markets can still reprice if the vote split widens or the dots move. Equally, a rate change that was fully expected may produce a muted reaction if the statement and projections confirm what was already priced in.
Whether you are reviewing top rate hike trends from past tightening cycles, building your own best rate hike guide, or reading a rate cut guide for 2026 ahead of the next meeting, the method stays the same:
-
Check the decision against market expectations.
-
Compare the statement with the previous one.
-
Review the vote split and any dissents.
-
On projection months, study how the dots have changed.
Keeping a simple log of Fed rate data for 2026, with each decision, its vote tally and the median dot, makes it easier to put every new announcement in context.
How Rate Decisions Can Affect Markets

Interest rate expectations can influence a wide range of markets. Currency pairs can react to changes in rate differentials between economies. Gold, which pays no interest, is often sensitive to shifts in rate expectations. Stock indices and bond yields can also move as markets reassess borrowing costs and growth. Volatility often rises around announcements, so spreads and price gaps can widen at those times.
Understanding the anatomy of a rate decision won't tell you where markets will go, but it helps you understand why they move.
Trade FX, gold and indices on MT5 with Trust Capital.


